01What it is
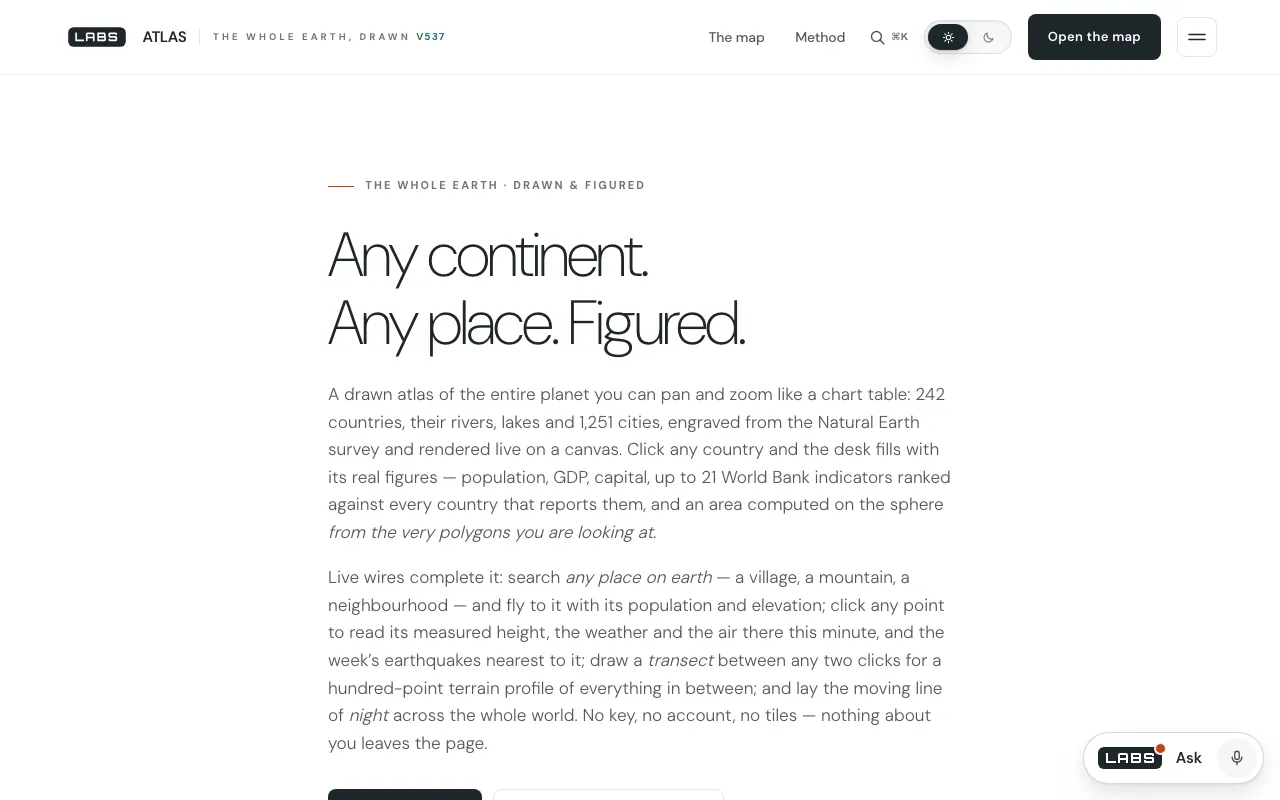
ATLAS is a world atlas that labs.llc draws itself. No map-tile company sits behind it. The page carries 242 countries, 1,251 cities, and Natural Earth's lakes and rivers, and you pan and zoom across them on a canvas. Choose a country and you get its population, GDP, an area worked out from its own outline, and up to 21 World Bank indicators ranked against every other country. Click any point and it reads that spot's elevation, current weather and air quality. It also plots the week's earthquakes, draws a terrain profile between two points and shades the night side of the Earth.
It suits students, teachers, travellers and the curious: people who want country facts and live conditions together, without an account.
02How it works
The geography ships with the page: a 1.64 MB extract of Natural Earth at 1:50m, which is public domain, quantised to 0.001° (about 110 m) and delta-encoded (atlas/assets/js/atlas-data.js, built by atlas/tools/mkatlas.py). The World Bank figures were read from the Bank's keyless API when that pack was built, each one the latest year the country reported. A series with no data is dropped rather than shown as zero, and decimal places are set per series so a figure never looks more precise than its survey.
The live layers go straight from your browser to open, keyless services: Open-Meteo for place search, weather, air quality and elevation, including the 100-point transect along a great circle (atlas.js:811-816, 943, 970, 1121-1151), and USGS for the week's M2.5+ quakes (atlas.js:203). A Content-Security-Policy in atlas/.htaccess lets the page connect to those hosts and its analytics, nothing else. The night line is computed from the sun's position (atlas.js:177-183, 359-364).
03The test
| UTC | What we did | What came back |
|---|---|---|
| 20:02:29 | Page and data pack, local 537 copy | Page HTTP 200, 62,282 bytes; pack 200, 1,644,905 bytes. Parsed: 242 countries, 1,251 places, 412 lakes, 895 rivers, 21 indicator series, 217 countries carrying them. |
| 20:02:29 | USGS week feed | HTTP 200, 226,760 bytes in 0.06 s: 320 quakes of M2.5+. |
| 20:02:29 | Open-Meteo elevation at 27.9881, 86.9250 (Everest summit) | HTTP 200 in 0.40 s: 8,724 m, about 125 m below the surveyed 8,848.86 m. |
The Everest reading is the instructive one. A gridded terrain model smooths peaks, and the page passes the model's number on as given.
04Against the field
Each comparator was read on its own site on the date shown. We credit what each does better before saying where ATLAS goes further.
Google Earth
Checked 27 Sep 2026, 20:07 UTC, through Google's own pages and support article 148134 (the web app itself returned only a browser-compatibility page); Voyager's quizzes confirmed on Google's own blog at 20:46 UTC.
A 3D globe of satellite and aerial imagery with 3D buildings, a Measure tool on the web and guided Voyager tours; Google Earth Pro on desktop draws an elevation profile along a path.
Where it does better
- Real imagery and 3D terrain down to street level, with 3D buildings in more than 2,500 cities.
- A fuller elevation profile, in feet or metres, in Google Earth Pro.
- Guided tours and quizzes.
Where ATLAS goes further
- Country statistics on the map: up to 21 World Bank series, each ranked against every country.
- Weather, PM2.5, PM10 and European AQI at any clicked point, plus the week's quakes, from named sources (
atlas.js:203, 811-816).
Our World in Data
Fetched 27 Sep 2026, 20:07 UTC.
An open library of more than 14,000 interactive charts across 120-plus topics, drawing on the WHO, the UN and the World Bank, free to reuse under a Creative Commons licence.
Where it does better
- Far more indicators, with full time series instead of one latest year.
- Downloadable data and a clear reuse licence.
- Explanatory writing on every topic.
Where ATLAS goes further
- Puts the figures on a navigable map beside live local conditions and a terrain profile, in one page.
- Computes each country's area from the outline it draws, so the number and the shape agree (
atlas.js:4-6).
05Where it falls short
- No imagery and no streets. At 1:50m, quantised to roughly 110 m, it is a country-and-city atlas, not a map to navigate by.
- The World Bank numbers are a snapshot baked in at build time, and 25 of the 242 countries, Taiwan and Somaliland among them, carry none.
- Point elevations smooth the peaks: 8,724 m at the Everest summit coordinates.
- The night line uses a low-precision solar formula (
atlas.js:177-180): right at map scale, not an almanac.
06Filing note
File underCountry facts and live conditions on one map, with every number's origin stated.
ATLAS wins on care with its numbers, not on pictures. Empty series are left out, precision is set per series, areas match the shapes drawn, and every live layer names its host. Open Google Earth for imagery and streets, and Our World in Data for history and downloads. Open ATLAS when you want one country's profile, the weather there and the ground between two points in a single view.
07Spec sheet
| Address | labs.llc/atlas/ |
|---|---|
| Where it runs | In your browser; live layers read directly, no relay |
| Map data | Natural Earth 1:50m, embedded (1,644,905 bytes) |
| Country figures | World Bank, 21 series, fixed at build time; 217 of 242 countries |
| Live sources | Open-Meteo (forecast, air quality, elevation, search); USGS quakes |
| Account | None |
| Measured | 27 Sep 2026, 20:02 UTC, local build 537 |
| Set against | Google Earth; Our World in Data |
| Main limit | No imagery or streets; figures not live |