01What it is
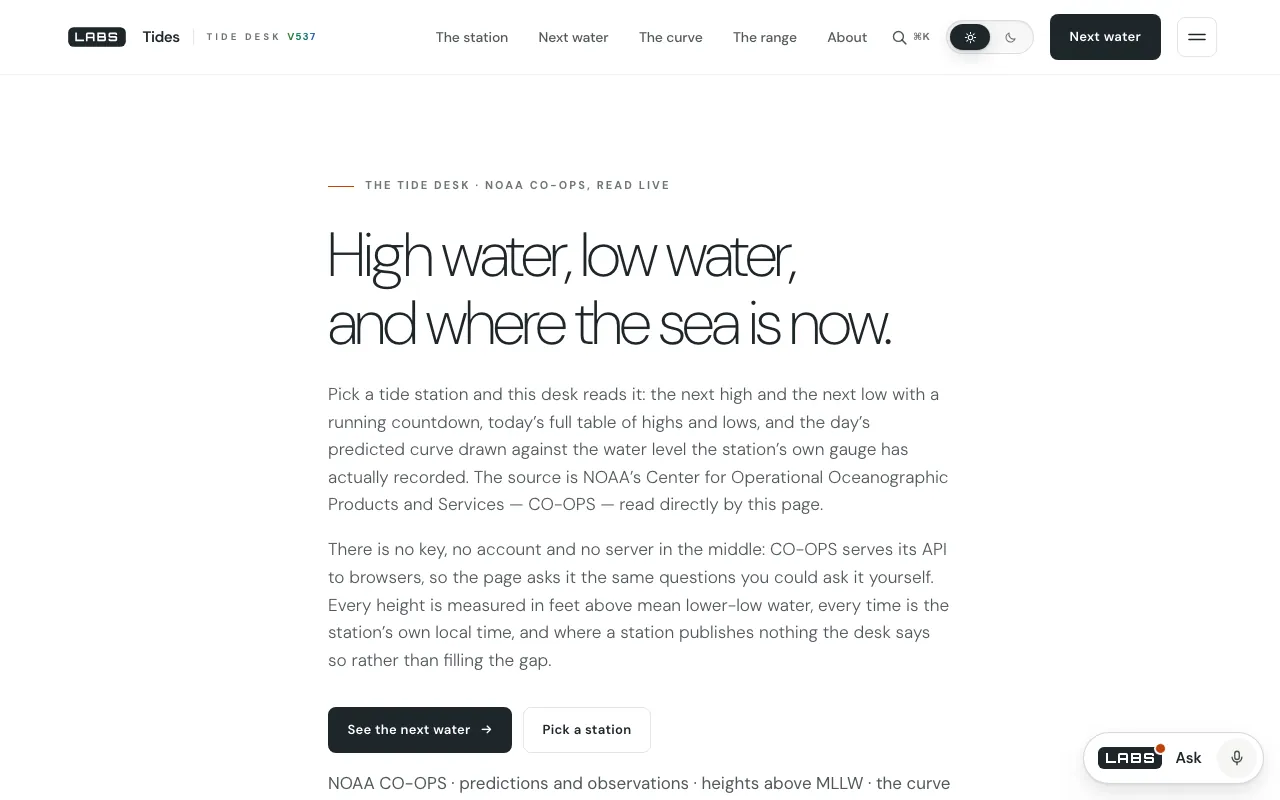
Tides is a desk for any NOAA CO-OPS tide-prediction station. It shows the next high and the next low in the station's local time, with the height above mean lower low water (MLLW) and a live countdown, then today's table of highs and lows, then the day's predicted curve drawn against the water level the gauge actually recorded.
It is for anyone near a US coast who needs the next tide: anglers, kayakers, sailors, beach-goers and clam-diggers.
02How it works
The browser reads everything from one host, api.tidesandcurrents.noaa.gov, which allows any origin, so no relay sits in between (tides/assets/js/app.js, 990 lines). It uses NOAA's metadata API for the station list, record and datum sheet, and its data API for predictions, observed water level and temperatures. The observed line is re-read every six minutes, the gauge's own cadence (app.js:62).
The hard part is the clock. NOAA gives times in the station's local time without the offset, and your browser could be anywhere. So the page asks for the same high/low window twice, in station time and in GMT, pairs events by height and type, and takes the commonest difference as the offset. There is no time-zone table and nothing guessed from longitude; if nothing pairs, it shows no countdown rather than a wrong one (app.js:21-44). NOAA's refusals arrive as HTTP 200 with an error body, so one wrapper turns them into real errors carrying NOAA's own sentence (app.js:15-19). A subordinate station's figures are labelled as offsets from a reference gauge elsewhere.
03The test
| UTC | What we did | What came back |
|---|---|---|
| 20:01:53 | Page, local 537 copy | HTTP 200, 59,589 bytes. |
| 20:01:53 | Today's highs and lows at The Battery (8518750), as the page asks | HTTP 200 in 0.14 s, any origin allowed: low 03:07, high 08:56 (5.659 ft), low 15:38, high 21:17 (5.3 ft), station time. |
| 20:01:53 | The station list the picker uses | HTTP 200, 2,040,953 bytes in 0.17 s: 3,499 stations, 1,256 reference and 2,243 subordinate. |
| 20:01:58 | Observed water level, same station | HTTP 200: 160 six-minute readings so far, the latest 1.65 ft at 15:54, flagged preliminary. |
The Battery run shows why the desk needs no relay: the predictions came back in a seventh of a second with an open CORS header. The gauge had logged 160 readings by mid-afternoon, enough to draw a real line against the predicted one. The station list is the sobering row: 2,243 of the 3,499 are subordinate stations, predicted as offsets from a reference gauge elsewhere, with no observed line of their own to draw.
04Against the field
Each comparator was read on its own site on the date shown. We credit what each does better before saying where Tides goes further.
NOAA Tides & Currents, tide predictions
Fetched 27 Sep 2026, 20:07 UTC.
NOAA's own prediction page for each station, with choices of units, datum, time zone and interval, ranges up to 31 days, XML and TXT downloads and printable annual tables.
Where it does better
- Units, datum and time zone of your choice; the labs desk is feet above MLLW only.
- Up to 31 days, downloads and annual tables, where the desk shows today.
- It is the publisher of record.
Where Tides goes further
- A countdown that stays right wherever you are, because the offset is measured from NOAA's own data.
- Prediction and gauge on one curve, re-read every six minutes.
Tide-Forecast.com
Fetched 27 Sep 2026, 20:07 UTC.
Tide times, heights, tables and charts for 10,749 locations in 194 countries, with maps, a units preference and mobile apps.
Where it does better
- Worldwide coverage against the US only.
- A units preference.
- Mobile apps.
Where Tides goes further
- Plots what the sea actually did, from six-minute gauge readings, beside the prediction.
- Says when a station's figure is an offset from a distant gauge.
05Where it falls short
- US waters only: NOAA is the only source.
- Feet only; every request is hard-coded to US units (
app.js:50, 142). - Most stations have no gauge. 2,243 of 3,499 are subordinate, so the observed line, the desk's best feature, is missing there, though the page says so.
- A prediction, not a forecast: it does not model wind-driven surge ahead of time, as the page itself warns.
06Filing note
File underThe next tide at a US station, with the real sea drawn over the prediction.
Tides takes on the station's clock and solves it from NOAA's own data rather than a lookup table. Drawing the gauge over the prediction makes a surge visible at a glance. NOAA's page is the fuller reference and Tide-Forecast.com the wider atlas; for the next water at a US station, with what the gauge saw drawn in, open this desk.
07Spec sheet
| Address | labs.llc/tides/ |
|---|---|
| Where it runs | In your browser; no relay |
| Source | NOAA CO-OPS data and metadata APIs |
| Stations at test | 3,499 (1,256 reference, 2,243 subordinate) |
| Units | Feet above MLLW only |
| Observed refresh | Every 6 minutes |
| Remembers | Your station, in localStorage |
| Measured | 27 Sep 2026, 20:01 UTC |
| Set against | NOAA Tides & Currents; Tide-Forecast.com |